Classic Report, Interactive Report and Interactive Grid cell style based on data
Description of one of the ways of how to apply custom styles to cells in reports based on data in the cells


We should admit that often we need more customization than APEX gives us out-of-the-box. And one of the needed customization is custom cell (or row) styles based on data in the cell (or row) of your reports. In this blog post I am going to tell you about one of the ways of how to implement this for all three Classic Report, Interactive Report and Interactive Grid regions.
Let's imagine you have a report where you represent some data and you want to render data customly in some particular cells of a report based on your data. In example, it was a natural case for me when I had a report showing log messages of some service, and there were different levels of the messages. What I needed to do was to highlight rows with warnings and errors in the report.
So I had a column Log Level in my report, values of which could be Debug, Info, Notice, Warning or Error. And as you can guess, cells of this column with the value Warning had to be yellow and with the value Error - red.
For the Interactive Report region you can set Column formatting for your column, for example, based on a value of a hidden column. But you will affect only the inner contents of a cell in such a case. I mean, you can change the color of your text, or you can use an icon, but it's impossible to change the style of the whole cell. And that's why we'll be using some basic JavaScript magic to achieve our goal.
A bright side here is that my approach could be used for all report region types in APEX, though with some little changes. We'll be comparing our approach for the Classic Report, Interactive Report and Interactive Grid regions.
Description of the approach
Generally, I am going to use the same approach to apply custom report cell styling. It could be devided into these steps:
- Implement custom styles for the cells - write some custom inline CSS in a page CSS section or in a separate file and then include this file to the page or to the application in general. In this post I am going to use standard Universal Theme
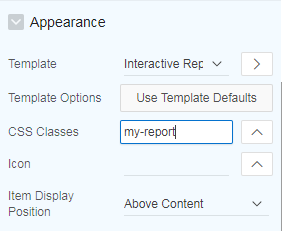
u-warningandu-dangerclasses as style modifiers (common step). - Mark your report somehow. In this post, I'll add
my-reportclass to all three reports under Appearance section (common step):
- Make the desired cells of the report recognizable. It means, we need some criteria to find the cells using a CSS selector.
- Implement a JavaScript function to highlight the needed report cells.
- Make the function execute when it's needed (on page load and report page change). In this blog post we are going to use a dynamic action for this.
So, as you can see, nothing impossible, though due to different architecture of the APEX report regions, recognition criteria, selectors and dynamic actions are going to be slightly different.
Classic Report
Let's start with the Classic Report region.
The selector
Implementation of the Classic Report is so that every report cell td tag has the headers attribute. It has the value which is equal to the report column name. In example, if the column is called COUNTRY, then the td tag would look something like <td class="t-Report-cell" headers="COUNTRY">. We are going to use this to catch our cells.
Using CSS, the needed selector for the cells in this column would be .my-report td[headers=COUNTRY]. This selector returns all the td elements with the attribute named headers equals to COUNTRY inside a container element with my-report class.
The function
To change a cell style, we first need to find it, and then apply some new CSS classes (or whatever) on-the-fly. Also, what is importnant, we do not need to change the style of all the cells, but only of those ones, which have particular data inside.
So, let's write our function then:
function highlight_сr_cells() {
    $(".my-report td[headers=COUNTRY]").each(function(){
        cellData = $(this).text();
        if (cellData == 'Austria') {
            $(this).addClass('u-warning');
        }
        else if (cellData == 'Switzerland') {
            $(this).addClass('u-danger');
        }
    });
};
Let's analyze it line-by-line:
- On line 2 we are selecting all the cells of the desired column. Then we are going to apply some function to each of the found cells.
- On line 3 we are saving the cell data into a variable.
- On lines 4-6 we compare the data to the value
Austriaand addu-warningclass to the found element in such a case. - On lines 7-9 we compare the data to the value
Switzerlandand addu-dangerclass to the found element in such a case. - Profit!
The scope
But it's not enought just to implement the function, you need to make it work. We could easily add execution of the function on page load (by adding highlight_сr_cells(); to the Execute when Page Loads under page JavaScript section), but it's not enough, because the page is not reloaded every time when the user changes a page of the report (fortunaltely). So, we need to execute the function every time when the user changes a report page and on page load.
And this is where dynamic actions come! All we need to do is to create one with this properties:
- When: After Refresh
- Selection Type: Region
- Region: <Your Classic Report Region name>
- On True:
- Action: Execute JavaScript Code
- Code:
highlight_сr_cells(); - Fire on Initialization: Yes
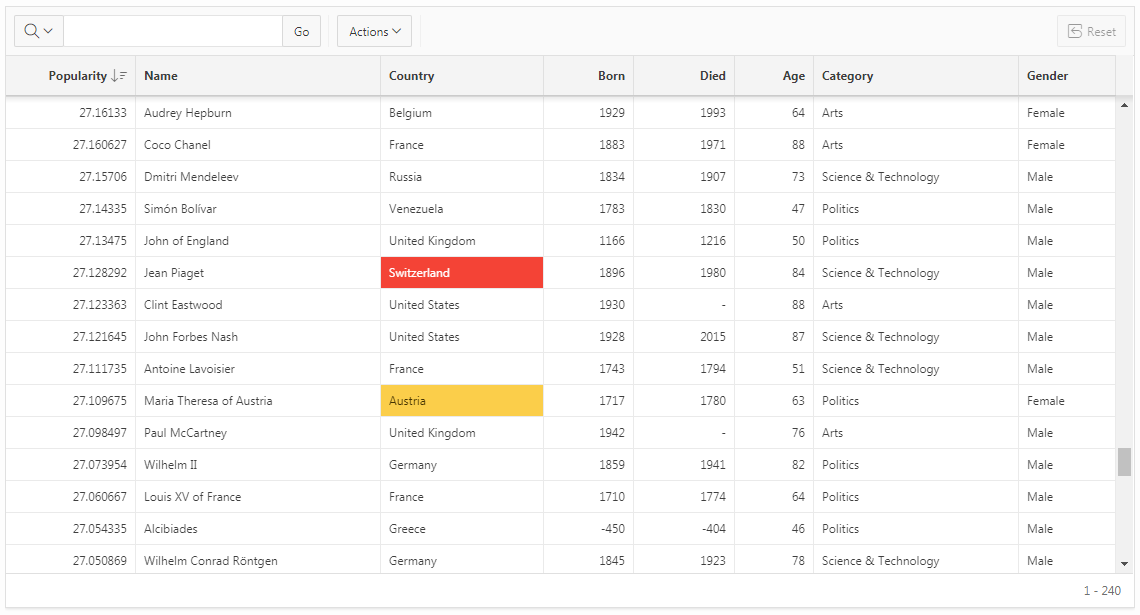
Result
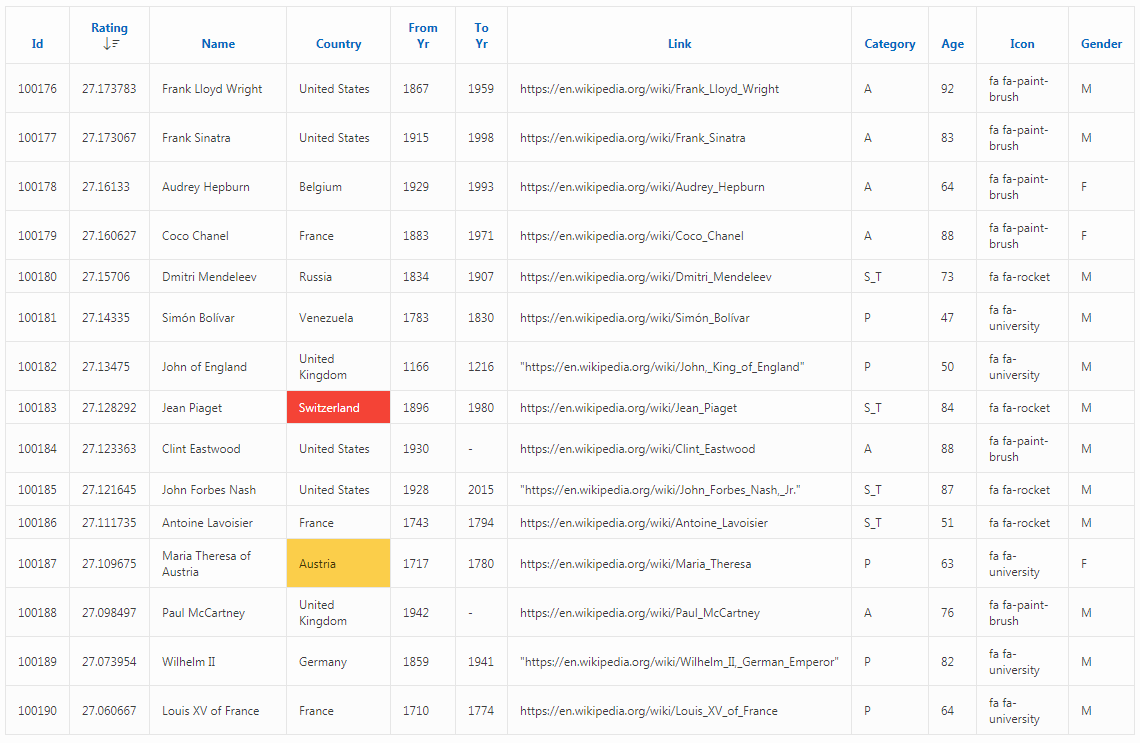
As you see, the desired columns are highlighted, and only when they contain particular data.
Interactive Report
Differences for the Interective Report region are mainly in the selector type.
The selector
For the interactive report we can use its column Static ID functionality. All we need to do is to find the desired column of the report in the App Builder (in our example it's COUNTRY) and set a value to the column Static ID. I'll use the value my-column for it.
App Builder help tells this about the property:
Enter the static ID for the column. If defined, the static ID is used as the ID for the corresponding table header (TH) cell, and as the HEADERS value for corresponding table data (TD) cells. The static ID can be useful when developing custom JavaScript behavior, or custom style for the column. If the static ID is not defined, the table generates an internal ID for these attribute values.
So, it meants in order to select all the desired cells, we need to use this selector: .my-report td[headers=my-column].
The function
Let's rewrite our function. As you will see, the only difference in it will be in the used selector:
function highlight_ir_cells() {
    $(".my-report td[headers=my-column]").each(function(){
        cellData = $(this).text();
        if (cellData == 'Austria') {
            $(this).addClass('u-warning');
        }
        else if (cellData == 'Switzerland') {
            $(this).addClass('u-danger');
        }
    });
};
The scope
The dynamic action for the Interactive Report region will be totally the same as we implemented before for the Classic Report region. So, its properties should look like this:
- When: After Refresh
- Selection Type: Region
- Region: <Your Interactive Report Region name>
- On True:
- Action: Execute JavaScript Code
- Code:
highlight_ir_cells(); - Fire on Initialization: Yes
Result
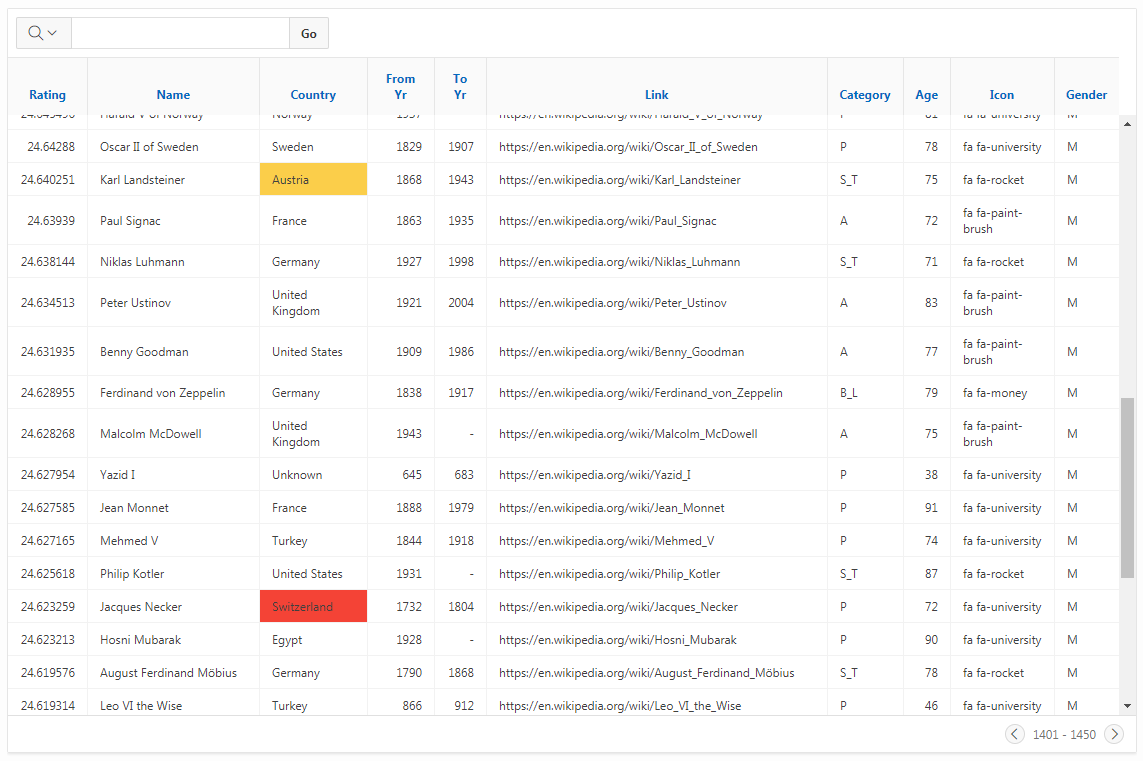
As before, the desired columns are highlighted, and only when they contain the desired data.
Interactive Grid
Interactive grid is a relatively new type of the report region in APEX. It works slighlty differently and fires different events, that's why the approach will be also changed a bit.
The selector
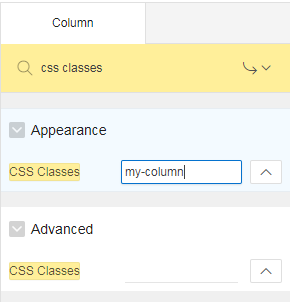
Fortunately, for interactive grids it's possible to set CSS classes for its columns. And this is the first thing to do. Let's add my-column class to the COUNTRY column of our grid (but be careful, use CSS Classes property under the Appearance section, not the one in the Advanced one):
After doing so, all td tags of the column will contain this class, and the selector should look as: .my-report td.my-column. Easier, isn't it?
The function
As before, the higlighting function will differ only in the selector:
function highlight_ig_cells() {
    $(".my-report td.my-column").each(function(){
        cellData = $(this).text();
        if (cellData == 'Austria') {
            $(this).addClass('u-warning');
        }
        else if (cellData == 'Switzerland') {
            $(this).addClass('u-danger');
        }
    });
};
The scope
The dynamic action for the Interactive Grid region will use a different event, because the After Refresh event is not fired when the user changes a page or does something else in Interactive Grid (because of some reason). So, the event which we need is Page Change [Interactive Grid]:
- When: Page Change [Interactive Grid]
- Selection Type: Region
- Region: <Your Interactive Grid Region name>
- On True:
- Action: Execute JavaScript Code
- Code:
highlight_ig_cells(); - Fire on Initialization: Yes
Result
Note the fact that the Page Change [Interactive Grid] event is definitely fired only when the page is actually changed (or new data loaded by progressive pagination). I am not sure that it'll be fired when, for example, the sorting is changed or filtering applied. That is why, perhaps, there should be some other dynamic actions added, which would listen to different Interactive Grid events - test this carefully before usage.
Bottomline
In this blog post I tried to tell you how to use the same custom styling approach for different types of report regions in APEX. Maybe my solution is not the best, but it works (I tested).
Unfortunately, nothing is perfect, neither is APEX, but sometimes this imperfection could be fixed by just a couple of lines of JavaScript code. However, what I would really like to see in APEX standard functionality is more customization in items and regions rendering out of the box. For report regions is should imply row, column and cell rendering customization. I really liked the datatables jQuery plugin approach - you are able to specify custom column renderer there based on data and it works just awesome! Maybe we'll see something similar in the future APEX releases.
Hope this article will be useful for some of you. Please, do not hesitate to give your feedback or know a better approach to achieve the same goals - I would be really happy to discuss it with you in the comments!